This function plots the estimated potential cumulative incidence functions or treatment effect curve with pointwise confidence intervals.
Arguments
- x
A fitted object returned by the function
tteICE,surv.tteICE, orscr.tteICE.- type
Which plot to create:
type="ate"indicates to plot the estimated treatment effects;type="inc"indicates to plot the estimated cumulative incidence functions (CIFs).- decrease
- conf.int
#' Confidence level for the pointwise confidence intervals If
conf.int = NULL, no confidence intervals are provided.- xlab
Label for the x-axis.
- xlim
A numeric vector of length 2 specifying the limits of the x-axis. If
xlim=NULL(default), the range is determined automatically from the data.- ylim
A numeric vector of length 2 giving the limits of the y-axis. If
ylim=NULL(default), the range is determined automatically by the type of plot, corresponding to the argument inplot_ateandplot_inc.- plot.configs
A named
listof additional plot configurations. See details inplot_ateandplot_inc- ...
Other arguments in function
plot.defaultor functioncurve
Examples
## load data
data(bmt)
bmt = transform(bmt, d4=d2+d3)
A = as.numeric(bmt$group>1)
bmt$A = A
library(survival)
## simple model fitting and plotting
fit1 = tteICE(Surv(t2, factor(d4))~A, data=bmt)
plot(fit1, type="ate")
 plot(fit1, type="inc")
 ## plot cumulative incidence functions with p-values
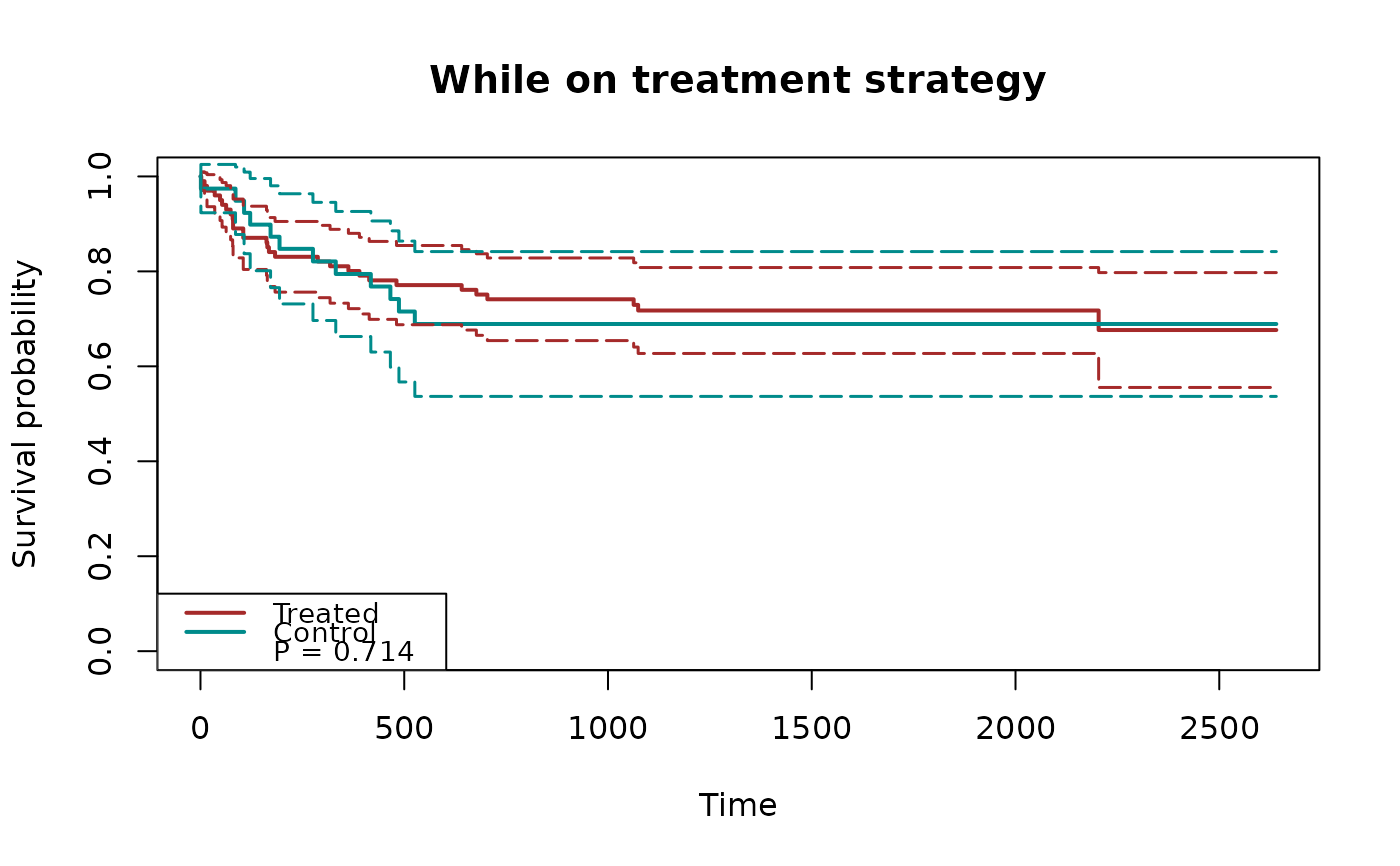
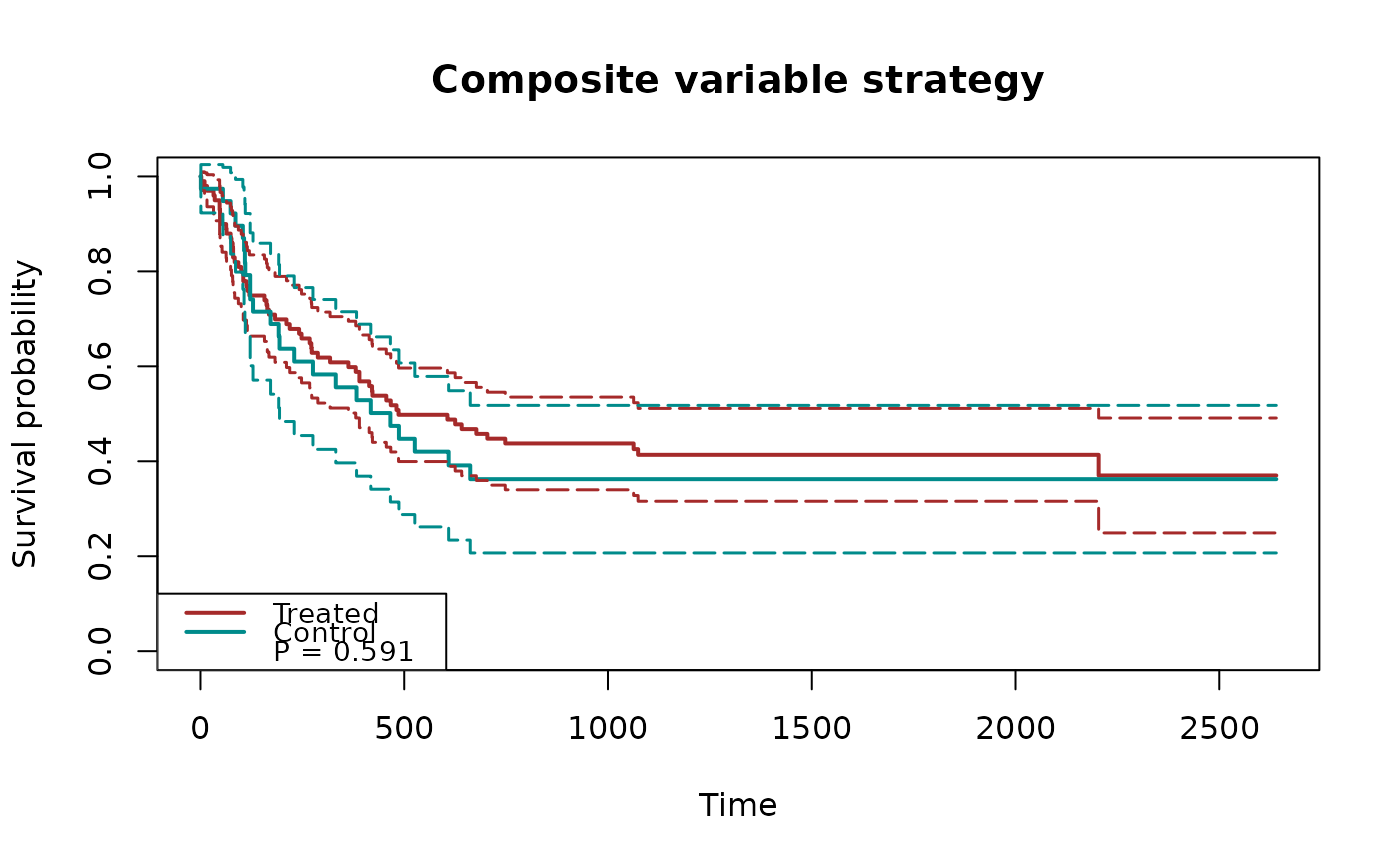
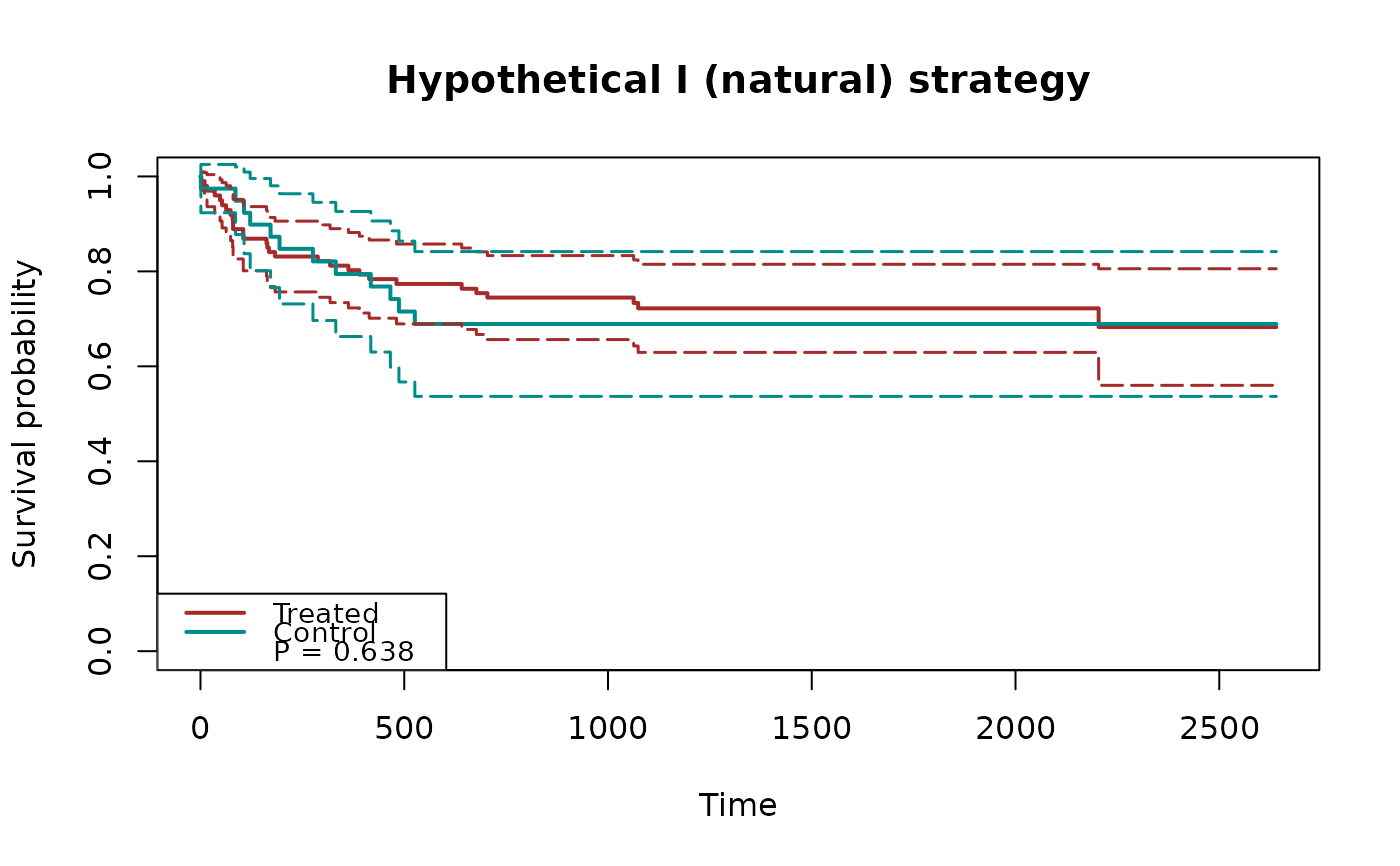
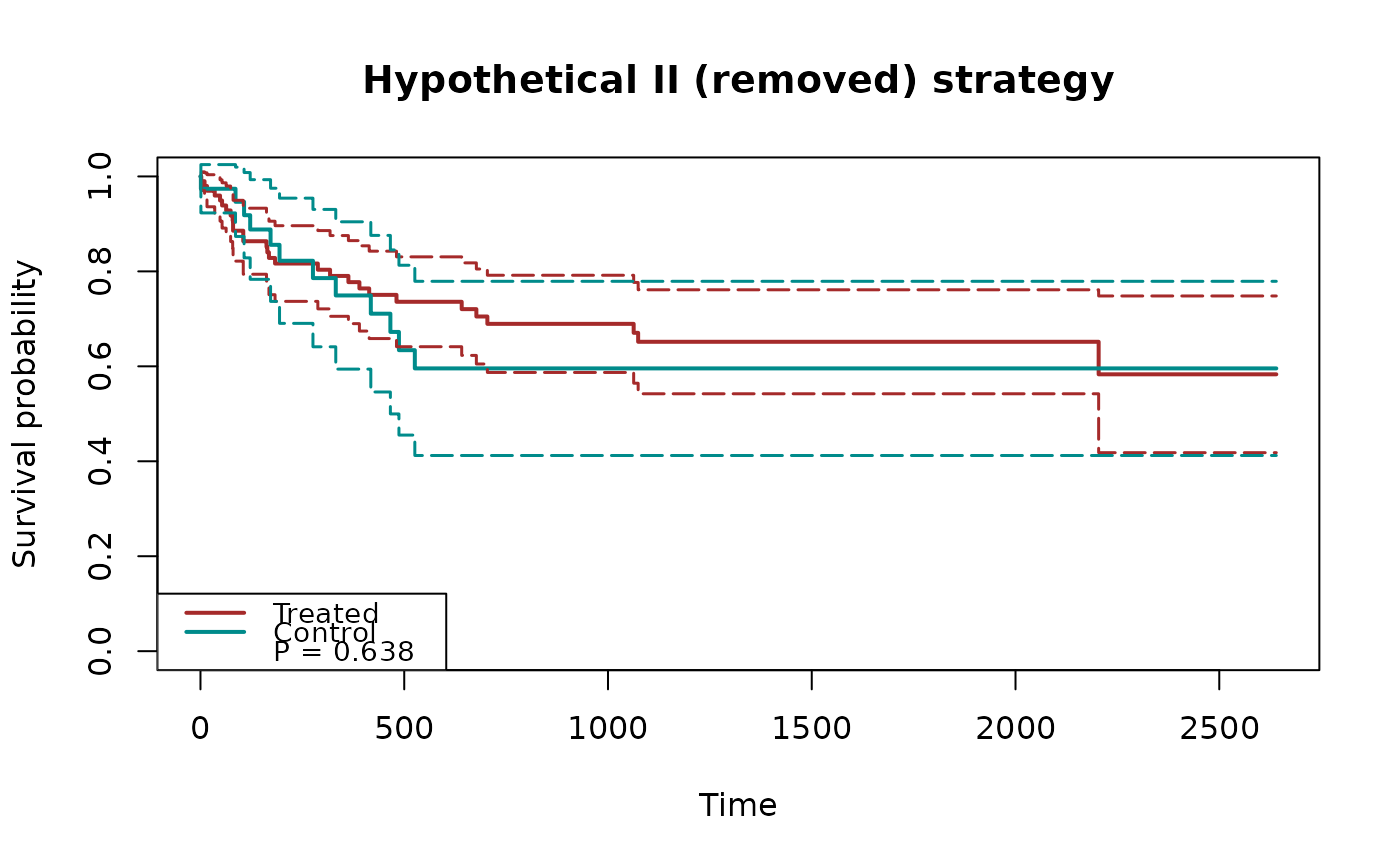
fit2 = surv.tteICE(A, bmt$t2, bmt$d4, "composite")
plot(fit2, type="inc", decrease=TRUE, ylim=c(0,1),
plot.configs=list(show.p.value=TRUE))
## plot cumulative incidence functions with p-values
fit2 = surv.tteICE(A, bmt$t2, bmt$d4, "composite")
plot(fit2, type="inc", decrease=TRUE, ylim=c(0,1),
plot.configs=list(show.p.value=TRUE))
 ## plot treatment effects for semicompeting risk data
fit3 = scr.tteICE(A, bmt$t1, bmt$d1, bmt$t2, bmt$d2, "composite")
plot(fit3, type="ate", ylim=c(-1,1), xlab="time",
plot.configs=list(col="red"))
## plot treatment effects for semicompeting risk data
fit3 = scr.tteICE(A, bmt$t1, bmt$d1, bmt$t2, bmt$d2, "composite")
plot(fit3, type="ate", ylim=c(-1,1), xlab="time",
plot.configs=list(col="red"))